Current edition: Q3 2026. Last updated September 2026. Public valuation data through August 31, 2026.
The L40° SaaS & Tech M&A Market Update is a quarterly read on where the SaaS and technology M&A market stands. It tracks public valuation multiples, private deal multiples, vertical dispersion, and deal activity side by side, and it is refreshed every quarter at this same URL.
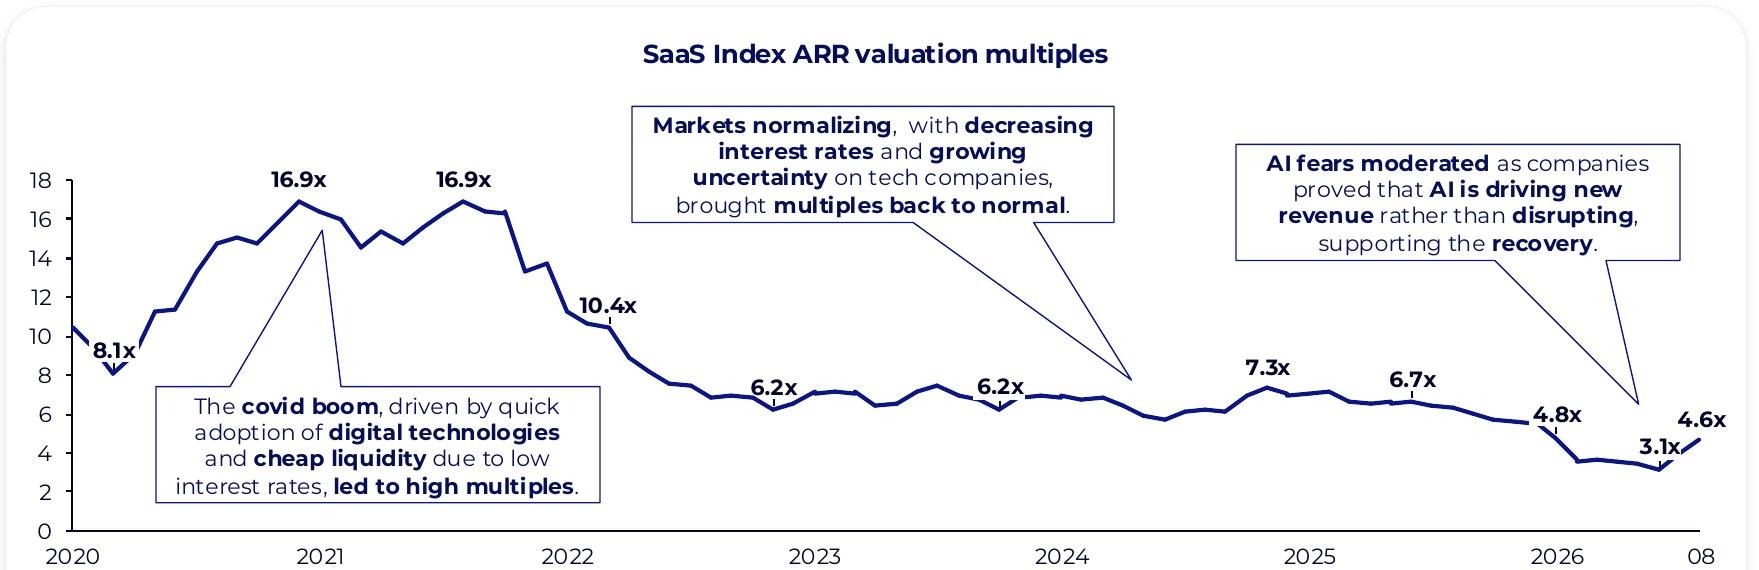
The Q3 2026 edition opens on a reversal. Public SaaS multiples fell to a decade-plus low of 3.1x ARR in June, then climbed to 4.6x by the end of August. The open question, and the one this edition carries forward, is whether that recovery holds through Q4 and for which verticals. Note industry dispersion throughout the report.
The sections below cover public multiples, vertical performance, private deal multiples, and deal activity, followed by a live 2026 sell-side example. Valuation methodology sits in L40°’s SaaS Multiples guide, deal-level detail in the Tech M&A Deal Radar, and buyer behavior in Who Is Buying SaaS Companies in 2026?
Point
Details
Public SaaS multiples are recovering from their 2026 low, but the recovery is not settled.
The SaaS Capital Index fell to 3.1x ARR in June 2026 and recovered to 4.6x ARR by August 31, 2026, across 63 public SaaS companies. Source: SaaS Capital; L40° analysis.
Public vertical performance has diverged by 108 points.
Cybersecurity and Identity led at +78% year to date through early September 2026, while ERP and Back-Office trailed at -30%. Source: L40° analysis.
Most private deals close far below the headline multiples.
Deal value has cooled from 2025, but strategic deal count has held.
Strategic deal value fell 18% and PE deal value 31% in H1 2026 versus H1 2025, while strategic buyers closed 137 to 155 deals per quarter across the last six quarters. Source: PitchBook; L40° analysis.
Competitive tension still drives the largest swings in outcome.
In a 2026 L40°-run sell-side process, the winning bidder raised total consideration 88% above its own first offer. Source: L40°, anonymized.
Public SaaS valuations: where multiples stand in Q3 2026
The SaaS Capital Index is the median ratio of market capitalization to annualized run-rate revenue across 63 US-listed, pure-play B2B SaaS companies, published monthly by SaaS Capital. It is built as a starting point for valuing private SaaS businesses, not as a private price.
The 2026 path has been steep in both directions. The index read 4.8x in January, fell to 3.1x in June, and recovered to 4.6x ARR at August 31, 2026, a rebound of roughly 48% in two months.
“AI fears moderated as companies proved that AI is driving new revenue rather than disrupting, supporting the recovery.”
— Juan Ignacio García Braschi, Managing Partner at L40°
However, this potential recovery is not yet a trend. Public markets remain exposed to geopolitical tension, US policy uncertainty, and macroeconomic volatility. Whether the second-half rebound holds through Q4 is the question that matters most for mid-market software founders timing a process.
Public multiples are also a different measure from private deal multiples. The index divides market capitalization by run-rate revenue; private transactions are priced on enterprise value and negotiated terms. Ranges by company profile, and the methodology behind them, are in SaaS Multiples: Valuation Benchmarks.
The L40° SaaS & Tech M&A Market Update is a quarterly reference on public and private SaaS and tech M&A conditions: valuation multiples, vertical performance, and deal activity. It draws on L40°’s quarterly market analysis and is refreshed at the same URL every quarter rather than published as a new article, with each past edition kept as a dated summary. The current edition covers Q3 2026.
How often is the Market Update refreshed?
The Market Update is refreshed every quarter with new valuation, vertical-performance, and deal-activity data. The current edition, Q3 2026, uses public valuation data through August 31, 2026 and vertical performance through early September 2026.
Are SaaS valuations recovering in 2026?
Public SaaS valuations are recovering, but unevenly. The SaaS Capital Index fell to 3.1x ARR in June 2026, a decade-plus low, and recovered to 4.6x ARR by August 31, 2026. Whether that holds through Q4 2026 remains open. In L40°’s experience, private multiples typically follow public movements with a lag of 6 to 12 months.
Which SaaS sectors are performing best right now?
As of early September 2026, Cybersecurity and Identity led public SaaS verticals at +78% year to date, followed by DevTools and Infrastructure at +47%. ERP and Back-Office lagged furthest at -30%, a 108-point spread between best and worst. This measures public stock performance, a different question from which verticals private buyers are most actively acquiring in.
What multiples are private SaaS and tech deals actually closing at?
As of Q3 2026, L40°’s analysis of 31 disclosed 2026 tech transactions shows that, excluding AI-driven outliers at 20x EV/Revenue or higher, deals averaged 6.2x EV/Revenue. Sub-$1bn deals averaged 3.9x. Roughly three-quarters of the capital deployed went to these non-outlier deals rather than to the headline multiples.
Is SaaS M&A deal activity slowing down in 2026?
Deal value is down; deal count is not. Strategic deal value fell 18% and PE deal value fell 31% in H1 2026 versus H1 2025, and the average strategic deal fell from about $250M to $200M. Strategic buyers still closed 137 to 155 transactions per quarter across the six quarters to Q2 2026, a market doing more, smaller deals. Deal-level activity is tracked in the L40° Tech M&A Deal Radar.
Is now a good time to sell a SaaS or tech company?
It depends on the business and the process. As of Q3 2026, public multiples are recovering unevenly, private multiples remain well below the AI-driven headline figures, and buyers continue to reward durable, defensible assets. In L40°’s view, process has a larger effect on the final outcome than market timing alone: in one 2026 L40° sell-side process, competitive tension lifted the winning bid 88% above that bidder’s first offer.
No items found.
About the author
Juan Ignacio García Braschi
Managing Partner & Founder of L40°
Juan Ignacio brings over 20 years of experience in investment banking and private equity. At L40°, he leads the firm's strategic direction and advises on complex, high-value transactions.
Disclaimer:
The content published on L40° Insights is for informational purposes only and does not constitute financial, legal, or investment advice. Insights reflect market experience and strategic analysis but are general in nature. Each business is different, and valuations, deal dynamics, and outcomes can vary significantly based on company-specific factors and market conditions. For guidance tailored to your circumstances, reach out to L40 advisors for professional support.
El riesgo de concentración de clientes ocurre cuando unos pocos clientes generan la mayor parte de tus ingresos. Descubre cómo se mide, por qué los compradores aplican descuentos y cómo los fundadores de SaaS pueden reducirlo antes de una venta.
Comprenda cómo el burn multiple afecta la valoración de una empresa SaaS y la confianza del comprador. Aprenda la fórmula, los puntos de referencia y las formas prácticas de mejorarlo antes de una salida.
Cómo se valoran las empresas de IA en una venta, por qué los múltiplos de salida son inferiores a los de las rondas de financiación y los factores que influyen en la cifra. Un marco para 2026 de L40°.
Dónde encontrarnos
Con oficinas en Miami, Lisboa y Madrid, L40° conecta Estados Unidos, Europa y Latinoamérica. Nuestro alcance internacional nos permite gestionar procesos de M&A y financiación con compradores, inversores e instituciones financieras de distintos mercados.
Con oficinas en Miami, Lisboa y Madrid, L40° conecta mercados globales para ofrecer resultados de alto impacto. Nuestra experiencia y alcance internacional garantizan que cada transacción se gestione con el máximo nivel de profesionalidad y atención.