Current edition: Q3 2026. Last updated September 2026. Public valuation data through August 31, 2026.
The L40° SaaS & Tech M&A Market Update is a quarterly read on where the SaaS and technology M&A market stands. It tracks public valuation multiples, private deal multiples, vertical dispersion, and deal activity side by side, and it is refreshed every quarter at this same URL.
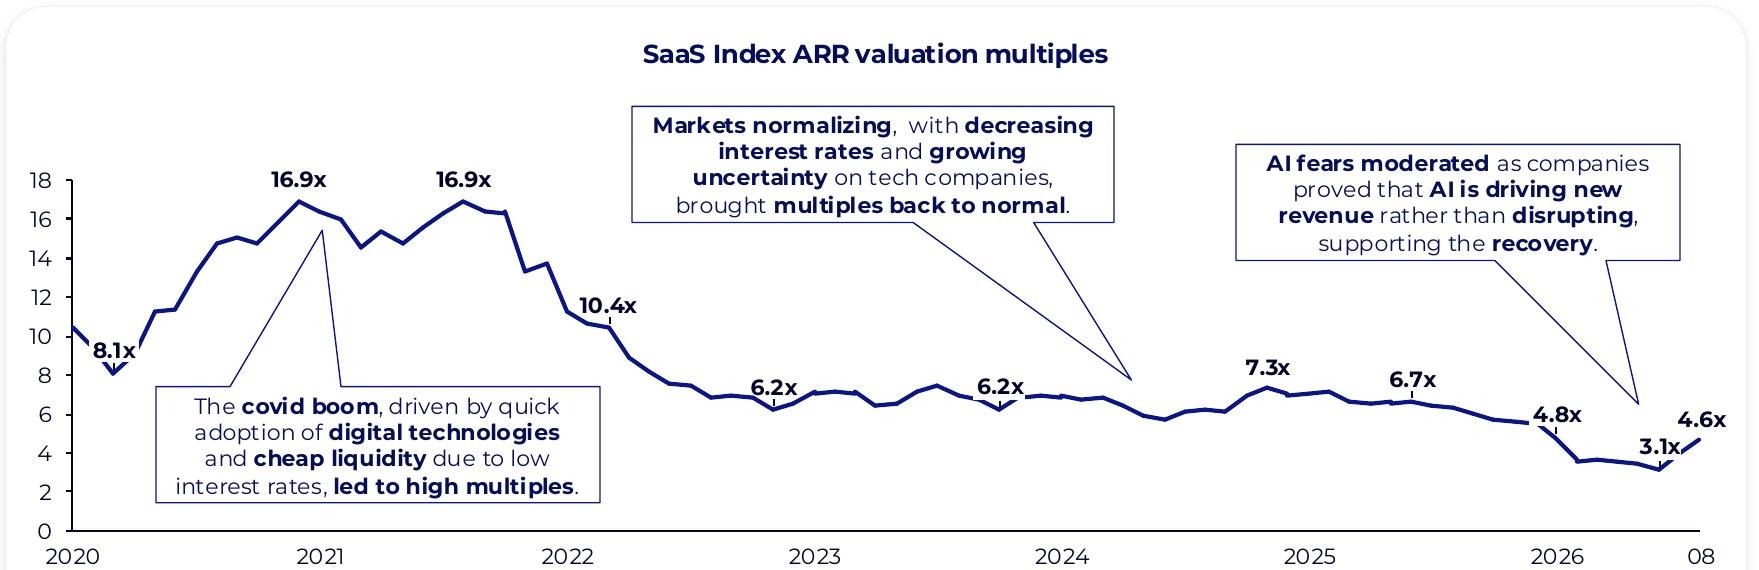
The Q3 2026 edition opens on a reversal. Public SaaS multiples fell to a decade-plus low of 3.1x ARR in June, then climbed to 4.6x by the end of August. The open question, and the one this edition carries forward, is whether that recovery holds through Q4 and for which verticals. Note industry dispersion throughout the report.
The sections below cover public multiples, vertical performance, private deal multiples, and deal activity, followed by a live 2026 sell-side example. Valuation methodology sits in L40°’s SaaS Multiples guide, deal-level detail in the Tech M&A Deal Radar, and buyer behavior in Who Is Buying SaaS Companies in 2026?
Key Takeaways
Download the full L40° SaaS & Tech M&A Q3 Market Update through this link.
Public SaaS valuations: where multiples stand in Q3 2026
The SaaS Capital Index is the median ratio of market capitalization to annualized run-rate revenue across 63 US-listed, pure-play B2B SaaS companies, published monthly by SaaS Capital. It is built as a starting point for valuing private SaaS businesses, not as a private price.
The index traded in a narrow range from late 2022 through late 2025, before fears that AI posed an existential risk to the SaaS model drove a sharp re-rating at the start of 2026.
The 2026 path has been steep in both directions. The index read 4.8x in January, fell to 3.1x in June, and recovered to 4.6x ARR at August 31, 2026, a rebound of roughly 48% in two months.

However, this potential recovery is not yet a trend. Public markets remain exposed to geopolitical tension, US policy uncertainty, and macroeconomic volatility. Whether the second-half rebound holds through Q4 is the question that matters most for mid-market software founders timing a process.
Public multiples are also a different measure from private deal multiples. The index divides market capitalization by run-rate revenue; private transactions are priced on enterprise value and negotiated terms. Ranges by company profile, and the methodology behind them, are in SaaS Multiples: Valuation Benchmarks.
Not every SaaS vertical is recovering the same way
This section measures public stock performance by vertical, year to date. It does not measure which verticals private buyers are most actively acquiring in. That is a separate question with a different answer, covered in Who Is Buying SaaS Companies in 2026?
Across the nine public SaaS verticals L40° tracks, year-to-date performance through early September 2026 ranges from +78% for Cybersecurity and Identity to -30% for ERP and Back-Office, a 108-point spread between the best and worst performers. DevTools and Infrastructure follows at +47%, while four of the nine verticals remain below their January level.
The low came in April. On April 9, the iShares Expanded Tech-Software Sector ETF closed at its lowest level since November 2023, and L40°’s tracking marks the April 10 selloff as the market’s low point amid heightened AI-driven uncertainty. The recovery was uneven from there: a sharp rally into early June, a pullback that took several of the weakest verticals back to or below their April levels, and a broader advance from July.
The two measures can point in opposite directions. ERP and Back-Office, the weakest public vertical in 2026, drew the heaviest acquirer interest in L40°’s mid-year buyer data. Public performance shows where investors are discounting AI risk. It does not show where private buyers stop paying.
What private tech M&A deals are actually closing at
The multiples making headlines in 2026 are being set by a small group of outliers, predominantly AI companies. But most capital is going elsewhere.
Across 31 disclosed 2026 tech transactions analyzed by L40°, deals at 20x EV/Revenue or higher averaged 29.3x and absorbed $22bn. The rest of the market averaged 6.2x on $62bn deployed, which means roughly 74% of capital went to non-outlier deals.
Below $1bn, the segment closest to L40°’s client base, the rest of the market averaged 3.9x on $4.5bn, against 26.6x on $1.5bn for outliers. The sample is limited to transactions with publicly available multiples, and many private acquisitions do not disclose terms, so these averages describe disclosed deals rather than the full market.
For AI-specific transactions, including the infrastructure deals behind much of the outlier group, see the L40° AI Rollup Transaction Index.
Deal value is down, deal count is not
Deal value has cooled from 2025’s peak. Strategic acquirers deployed $59bn in H1 2026, 18% less than in H1 2025, and their average deal value fell from about $250M to $200M. PE deal value fell 31% over the same period, to about $46bn.
On the other hand, deal count tells a different story. Strategic buyers closed between 137 and 155 acquisitions in each of the last six quarters, including 155 in Q2 2026, the highest in that period. PE buyers completed 223 acquisitions in H1 2026, on pace with 2024’s full-year 447 though below 2025’s 520, with buyouts taking a larger share than growth equity.
For strategic buyers, the market is doing smaller deals, not fewer. For deal-level activity, including disclosed EV/Revenue multiples on 2026 transactions, see the L40° Tech M&A Deal Radar.
What competitive tension does to the outcome: a live 2026 example
Market multiples describe the range. Process determines where a company lands within it.
In a 2026 sell-side process run by L40° for a company with an enterprise value in the $30M to $60M range, five offers were received and L40° negotiated the top two upward. All figures are indexed to Buyer 1’s first offer, set at 100, with names and amounts anonymized.
The first round was close. Buyer 1 offered 100, with 69 fixed and 31 contingent; Buyer 2 offered 94, with the same fixed amount. In the second round, Buyer 2 moved to 150 against Buyer 1’s 125. Buyer 1 responded in the final round with 188, 85 fixed and 103 contingent, and won against Buyer 2’s final 166.
Against its own first offer, Buyer 1 raised fixed consideration by 23% and total consideration by 88%. Most of that increase came through the contingent component, which is paid only if agreed conditions are met, so how it is defined and measured matters as much as its headline size.
None of that movement came from the market. It came from structured competition between qualified buyers, which is the core of a sell-side advisory mandate.
What this means for tech and software founders
Four implications follow from this quarter’s data.
- The AI headline multiple is not your comp. Outside the outliers, disclosed 2026 tech deals averaged 6.2x EV/Revenue, and 3.9x below $1bn, far from the 20x-plus figures that dominate coverage.
- Public dispersion is a leading indicator, not a private verdict. The 108-point spread between public verticals shows where investors are pricing AI risk. In L40°’s experience, private multiples follow public moves with a lag of 6 to 12 months, so the spread is a signal to watch, not a price to apply.
- Strategic deal count held as deal value fell. Strategic buyers are closing more, smaller transactions, a better read for a $5M to $100M ARR company than the headline decline in deal value suggests.
- The fundamentals buyers reward have not moved. Rule of 40, net revenue retention, and revenue-growth thresholds remain in line with L40°’s standing benchmarks, detailed in SaaS Multiples.
Tech M&A Market Update - Previous editions
Each edition is condensed into a dated entry here when the next one goes live, so figures stay anchored to the quarter they describe. Each edition reflects the data verified and available at the time of publication, and figures can move between editions as source data is revised.
H1 2026 edition, published June 9, 2026
- Public SaaS multiples had fallen to a decade-plus low as AI-substitution fears repriced public software.
- Private deal demand held up through the selloff, with private equity and strategic buyers continuing to transact.
- The early rebound was selective, led by identity, security, and vertical software, while buyer interest concentrated in ERP, DevTools, and FinTech.
Full analysis: Who Is Buying SaaS Companies in 2026? A Mid-Year Look at Where Demand Actually Is
Recommended Reads:
- SaaS Multiples: Valuation Benchmarks
- Who Is Buying SaaS Companies in 2026?
- L40° Tech M&A Deal Radar
- M&A Trends for 2026: What Tech Founders Should Expect